

This is my first ever Pollyanna post. I just wrote it in order to cheer myself about the world we live in. Consider it my New Year’s present.
We Live in the Best of Times
We seem to be in a world that is overwhelmed with bad news. War, terrorism, global warming, political dysfunction. So let’s pause for a moment and consider just how lucky we are to be living in the present age. The simple truth is that nearly everything is better now for human beings than it used to be.
Take income, for example. A study by economists Angus Maddison and colleagues figured out that in 2011 dollars, the global income of the average person per day during the time of Caesar Augustus was $2. It was still the same when the Normans invaded England in 1066. By the presidency of Thomas Jefferson in 1800, this average global income had risen to $2.80. Over 18 centuries, that’s an increase of just 40 percent.
Then things suddenly changed. Between 1800 and 1900 the average wage more than doubled. By 2016, the average global wage had risen to $40, while in the US the average daily income was $145. Even in the poorest continent, Africa, the average was now $13. In the two centuries since 1800, the global income level was 14 times higher, the US average was 24 times higher, and even Africa’s rate was 5 times higher. If the trend continues, the average global income in 2100 will rise to $166 and the US average to $605.
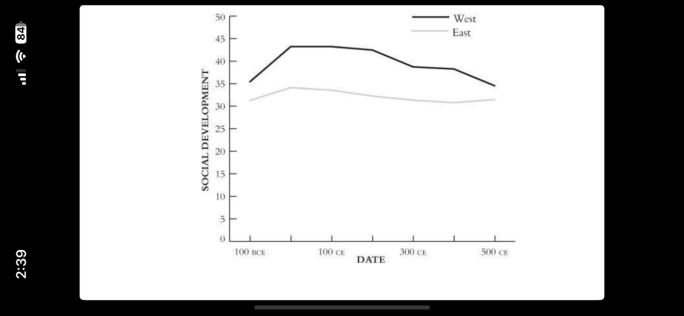
That’s an astonishing degree of income growth in a very short period of time. The reason for this sudden surge in prosperity, of course, is the industrial revolution, which took off in the early nineteenth century. Historian Ian Morris explores the roots of this sudden transformation in his book Why the West Rules – for Now. He tracks social development in the East and West across the last 2,000 years, using a measure composed of four equal elements: energy capture, urbanism (sign of organizational capacity), information processing (literacy, numeracy, science), and capacity to make war (sign of a strong state). He set 1000 as the development level in 2000.
By this measure, global social development hovered between 30 and 45 at the start of the Christian Era, with the West showing a modest advantage over the East, as you can see in the first chart below. As the Roman empire began its decline, the development level in the West began a long slow decline, as seen in the second chart.
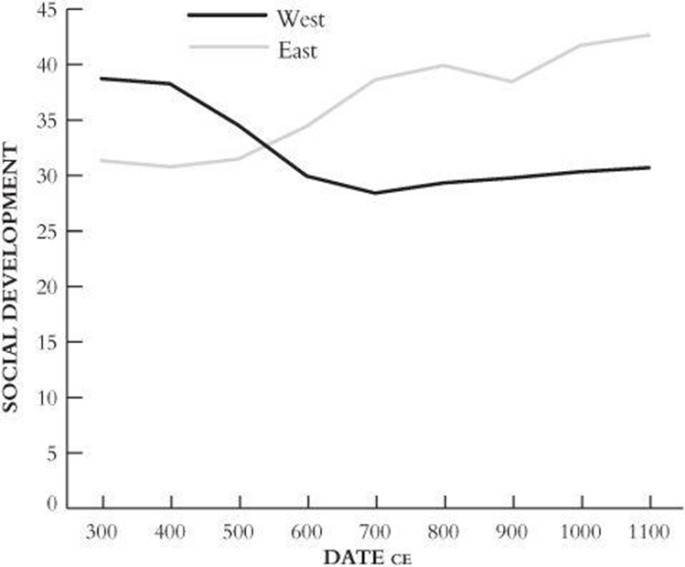
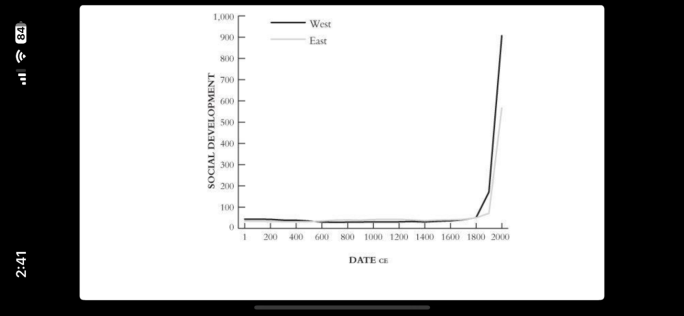
As the next chart shows, this pattern continued until about 1600, when development levels in the West had returned to the level at the height of Rome and then began to rise more quickly. The prime inflection point was 1800, when development started to shoot up, hitting 200 in 1900, and then accelerating across the twentieth century to reach 1000 in 2000.
Of the four components of social development, the one that changed most dramatically 200 years ago was energy capture. For all of human history before then, the prime sources of energy available to permit survival and fuel possible growth in standard of living were muscle power (both human and animal) and burning wood and dung. That’s it. When people figured out how to harness the extraordinarily more powerful energy found in coal and other fossil fuels, the possibilities for increased economic productivity were suddenly limitless.
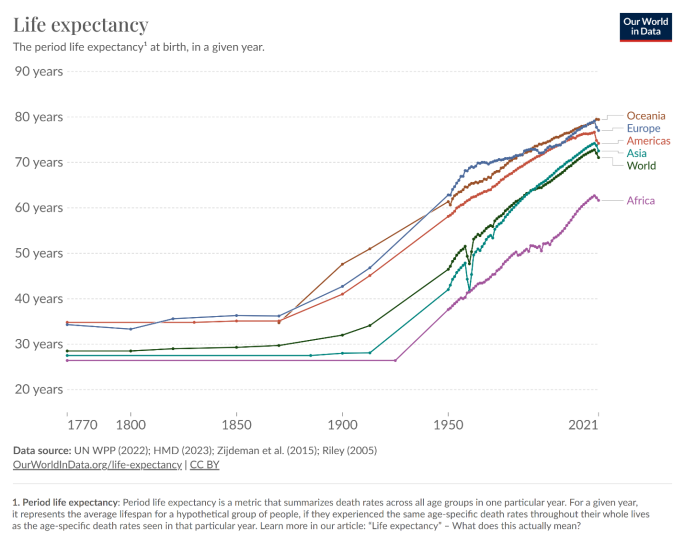
Along with the rapid increase in income came another great advance in the human condition, a rapid increase in life span. For most of human history, average life expectancy was about 30 years, primarily because about half of the population died in childhood. Today the world average child death rate is less that 5 percent. As a result, the average life span nearly tripled in most developed countries and has doubled in the poorest areas. And, as you can see in the chart below, most of this gain happened in the last 150 years.
Not only are we growing more prosperous and living longer, but we are also much less likely to die from violence than in the past. For most of human history, when people engaged in hunting and gathering and the early forms of agriculture, homicide rates were extremely high because of chronic raiding and feuding. Steven Pinker shows that, with the rise of states, which sought to establish a monopoly on violence, the homicide rate fell about fivefold. Below is figure 2-3 from his book.
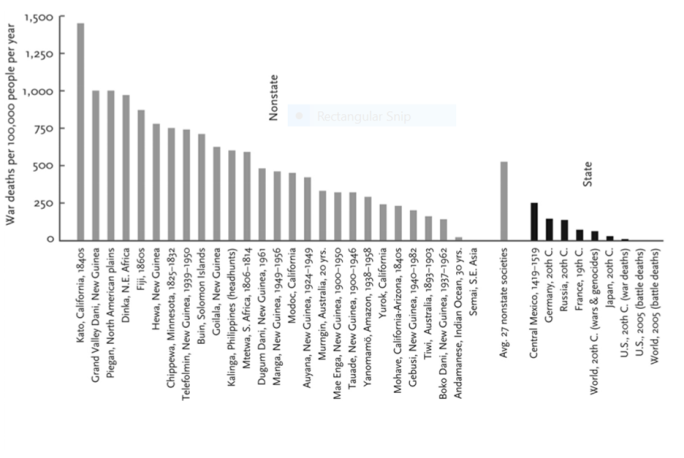
Note that before the existence of states, the average number of annual homicides per 100,000 people was enormous at around 700. And it remained quite high even for relatively recent nonstate societies such as California’s Mohave Indians in the 1840s. where the number was 250.
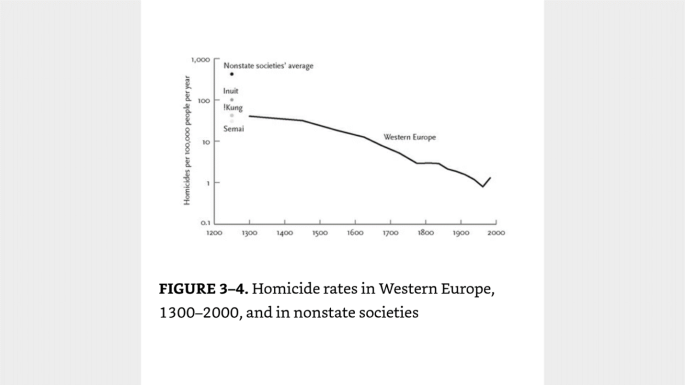
Then between the Middle Ages and present, European countries saw a fall in homicide rates to between 10 percent and 2 percent of the earlier rate. You can see this pattern in Pinker’s chart below, compressed vertically into a logarithmic scale, which shows a sharp downward trend rapidly heading toward 1 per 100,000.
The message is that state violence kills many fewer people than nonstate violence has over history.
Here’s a chart that shows the percentage of deaths in warfare for both nonstate and state societies.
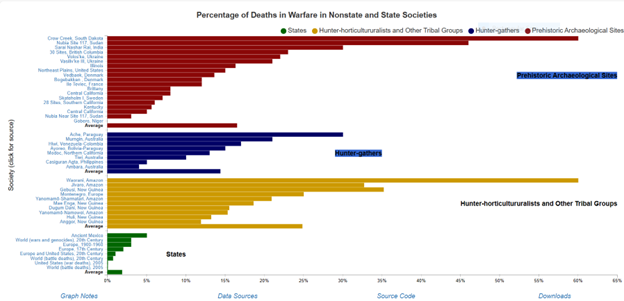
What’s most stunning for me in looking at this graph is how even the mass slaughter that occurred in the two world wars in the 20th century was so vastly less deadly than war in hunter-gatherer and early agricultural societies. For the South Dakota Creek Indians in the 1300s, 60% of the population died in war, whereas the global death rate from war during the 20th century was less than 1%.
So let’s turn from these long-term historical trends about life, death, and income and look instead at some recent patterns of social improvement. Here’s a collection of a dozen cases in point gathered by Gapminder.org.
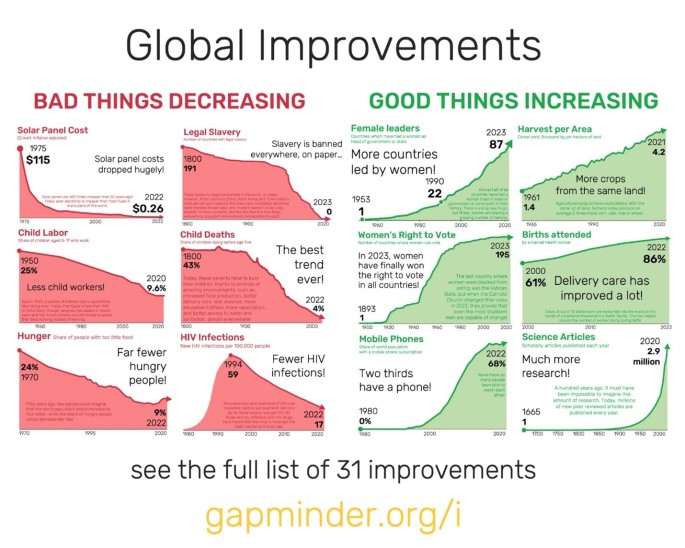
Not bad, eh?
So how about the environment? We hear a lot of bad news in this domain, but consider some of the good news. Is deforestation rampant across the globe? Yes and no. Developing countries do indeed tear down forests in the search of cheap energy and agricultural land, but the rate of deforestation is gradually declining. Meanwhile rich countries are in fact rapidly increasing the amount of forest cover.
The organization Human Progress figures that currently about 31% of the global land is covered in forest. North America and Europe now have more forest than they did at the start of industrialization. The UK alone has tripled its forest area since 1919 and will soon reach levels not seen since they were registered in the Domesday Book in 1086. The environmental Kuznets curve plots how economic development initially leads to environmental decline; but when GDP rises to about $4,500 per capita, reforestation begins to take place. Countries that have now reached this point and begun increasing forest are China, Russia, India, Bangladesh, and Vietnam. And when forests increase, so does biodiversity, as plant and wildlife populations grow. In the long run, therefore, development can actually be good for the environment.
Consider another environmental issue, rising sea levels. The Pacific island country Tuvalu has been in the news because it fears it will soon disappear into the sea. As an escape valve, Australia has voted to allow a steady stream of Tuvalu residents to move to Australia over time. But, as Bjorn Lomborg reports, recent research has shown that the land area of the island has actually been growing. While sea levels are rising, the sea is also breaking up old coral which then replenishes beaches in low-lying areas. In 40 years, the area of Tuvalu has expanded 2.9%.
Ok, what about crime rates? Here’s a graph from Statista showing the rate of violent crimes in the US from 1990 to 2022.
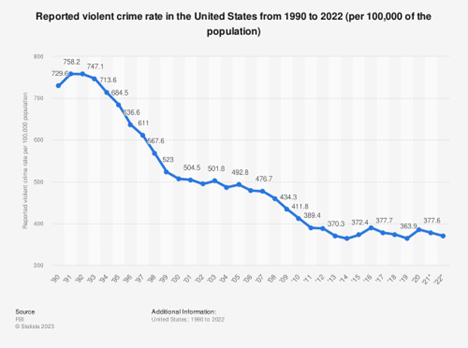
As you can see, the current rate is about half of what it was 30 years ago, declining from a high of 758 crimes per 100,000 to today’s 370. A short rise during Covid has since reverted to the new normal. More good news.
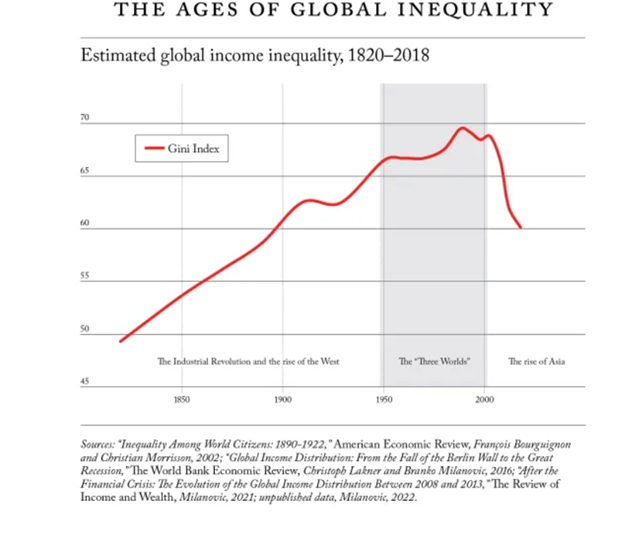
Consider yet another chronic problem: income inequality. In an article in Foreign Affairs, economist Branko Milanovic shows the change in global income inequality over the last 150 years using the Gini index, which ranges from 0 (total equality) to 100 (total inequality). Throughout the 19th and 20th centuries, the index rose steadily and from 50 to a peak of 70 in the year 2000. But in the last two decades, global inequality dramatically dropped to 60. As he points out, the primary reason for this was the sharp global rise in incomes levels in Asia, but he notes that income inequality within developed countries was also declining during this period.
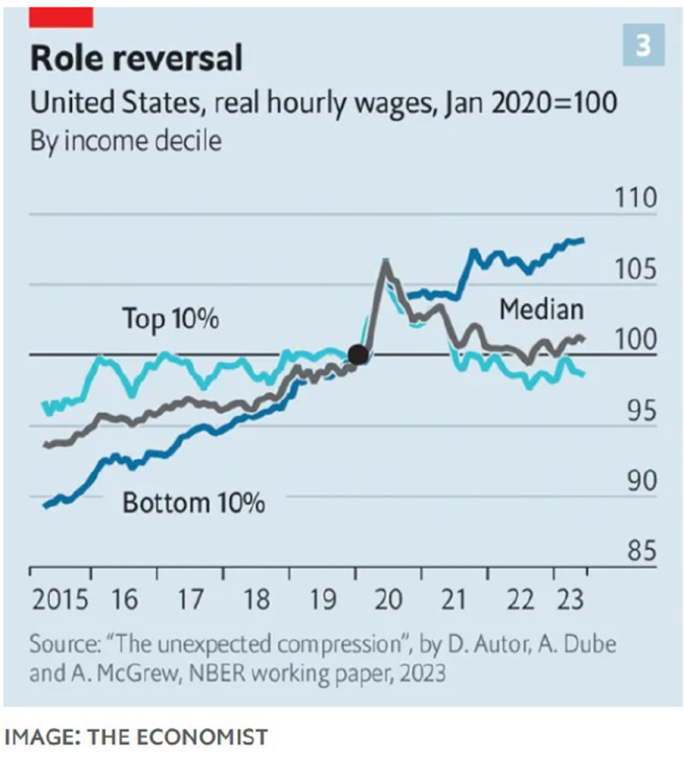
Take the case of the US. The graph below, from the Economist, shows a reversal in wage increases favoring lower paid workers. From 2015 to 2023, the wages of the lowest 10% of the workforce was rising much faster than the wages of the top 10%. This trend was exacerbated in 2020 by the impact of the Covid pandemic, which created a shortage of labor and gave workers increased leverage in winning wage increases. Economists estimate that since 2015, wage increases have erased 40% of the rise in wage inequality that occurred over the last 40 years.
All of this is not to say that everything’s hunky dory today. Climate change is a continuing threat and so is political dysfunction both at home and abroad. But when you look at the core issues that help define the quality of life – income, life expectancy, freedom from violence – things are better now than they have ever been. No sane person today would want to live in any era in the past, where nearly everything was worse. When we get depressed about what’s in the news, we need to remind ourselves that we are living in the best of times.
